How Models Work

You ask your cousin how he’s predicted real estate values in the past, and he says it is just intuition. But more questioning reveals that he’s identified price patterns from houses he has seen in the past, and he uses those patterns to make predictions for new houses he is considering.
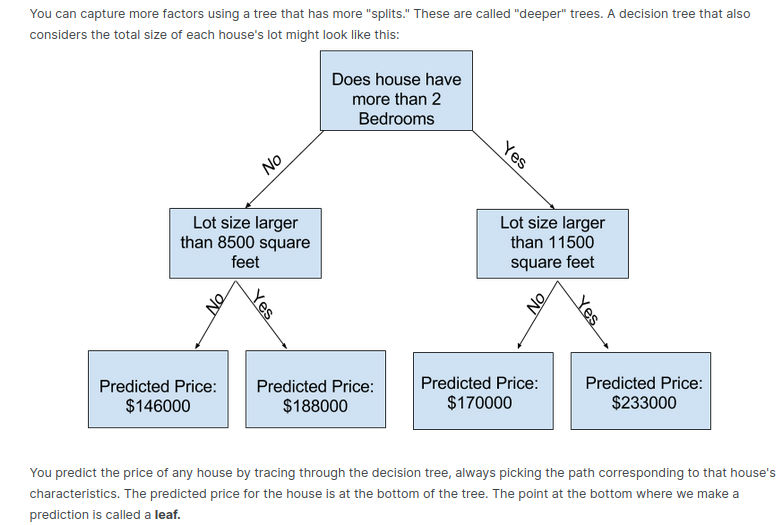
Machine learning works the same way. We’ll start with a model called the Decision Tree. There are fancier models that give more accurate predictions. But decision trees are easy to understand, and they are the basic building block for some of the best models in data science.
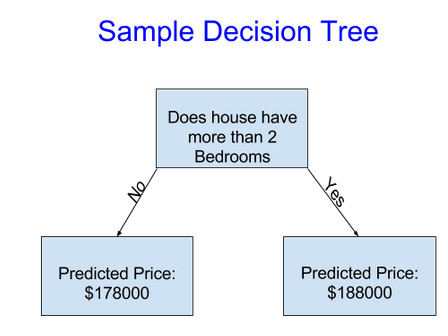
We use data to decide how to break the houses into two groups, and then again to determine the predicted price in each group. This step of capturing patterns from data is called fitting or training the model. The data used to fit the model is called the training data.
Basic Data Exploration

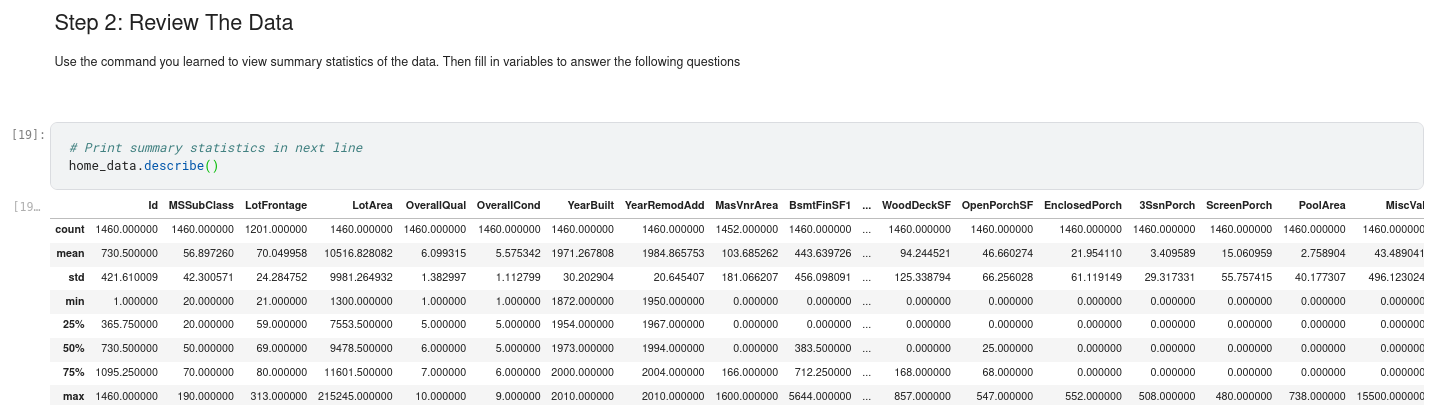
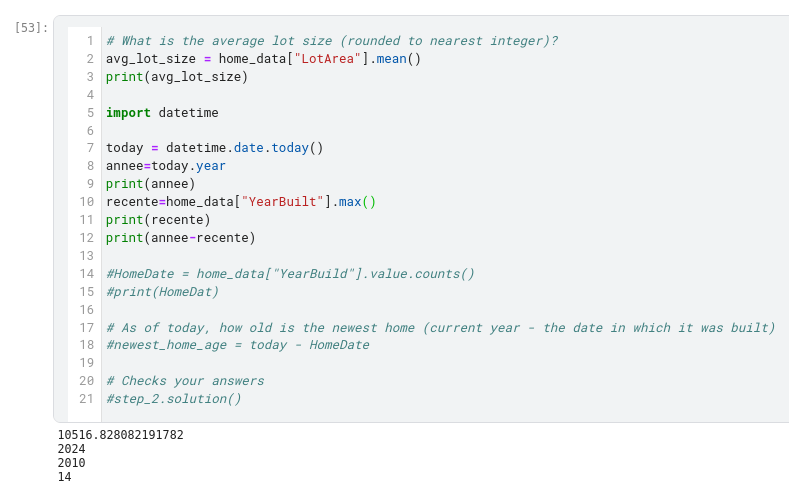
The newest house in your data isn’t that new. A few potential explanations for this:
- They haven’t built new houses where this data was collected.
- The data was collected a long time ago. Houses built after the data publication wouldn’t show up.
If the reason is explanation #1 above, does that affect your trust in the model you build with this data? What about if it is reason #2?
How could you dig into the data to see which explanation is more plausible?
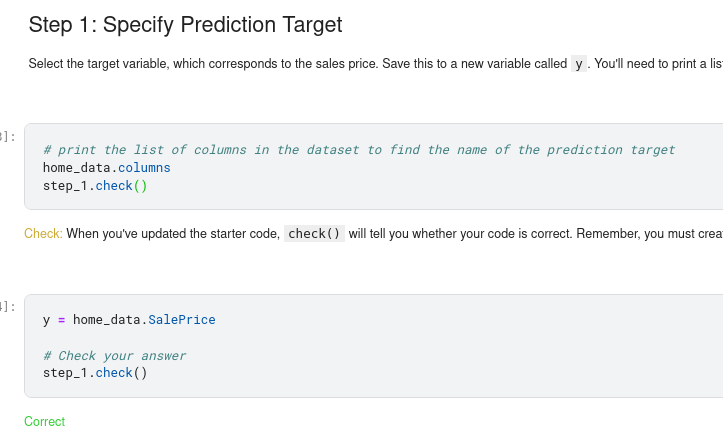
Your First Machine Learning Model
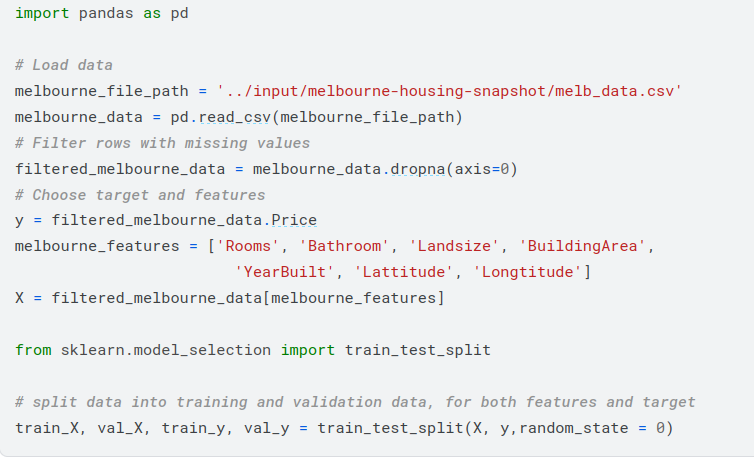
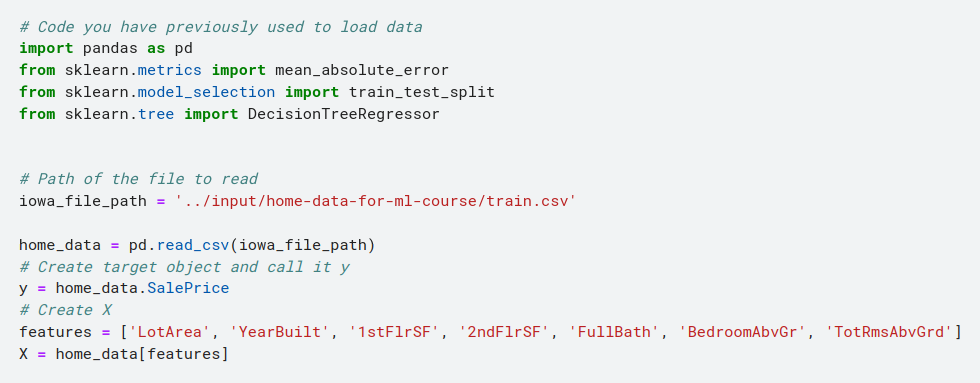
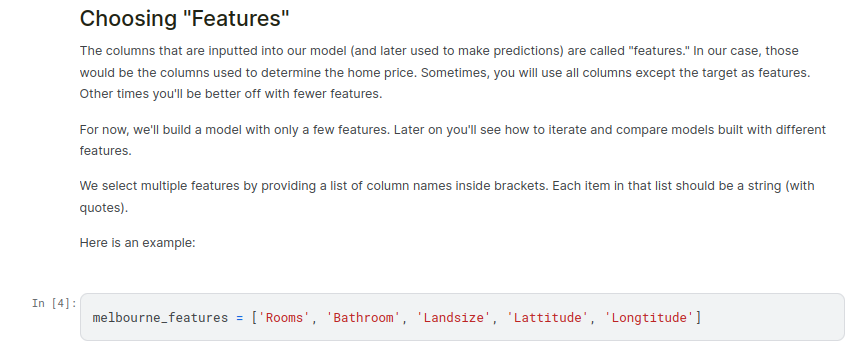
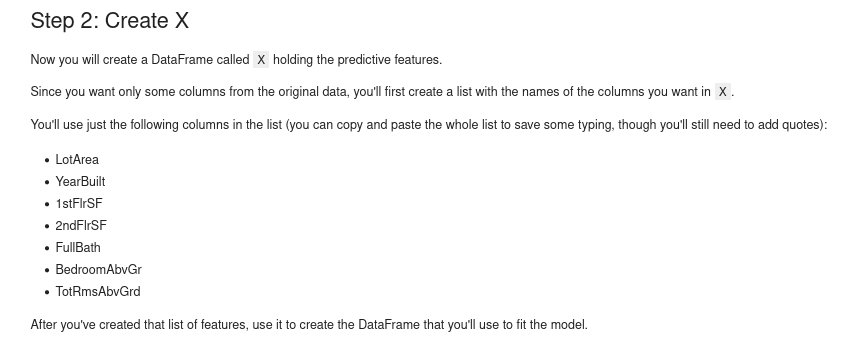
We’ll start by picking a few variables using our intuition. Later courses will show you statistical techniques to automatically prioritize variables.
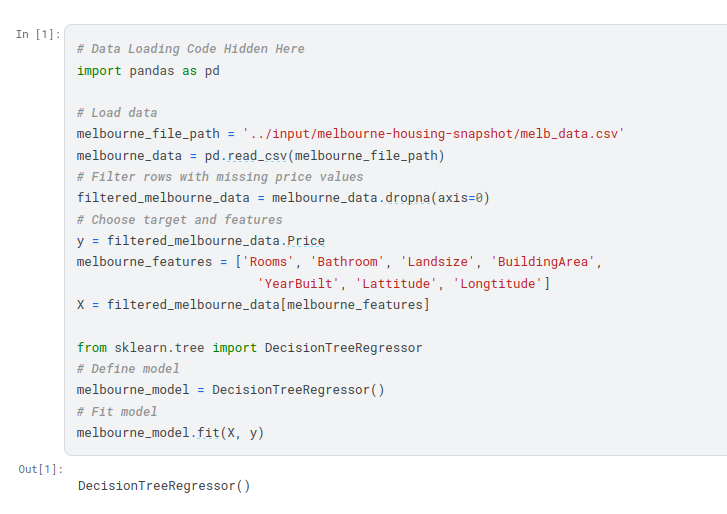
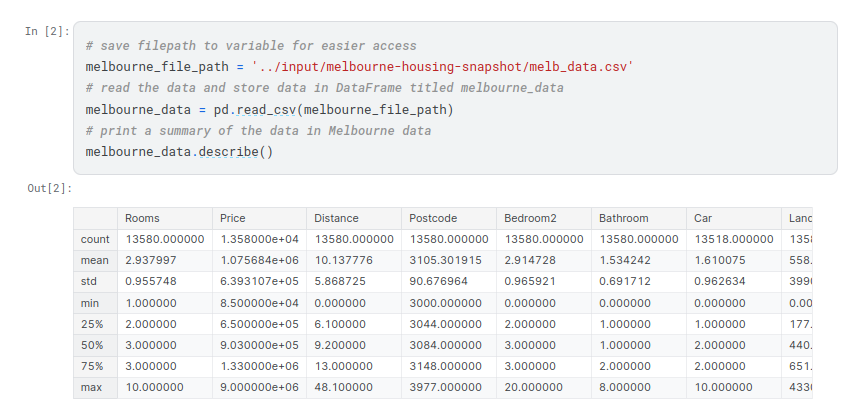
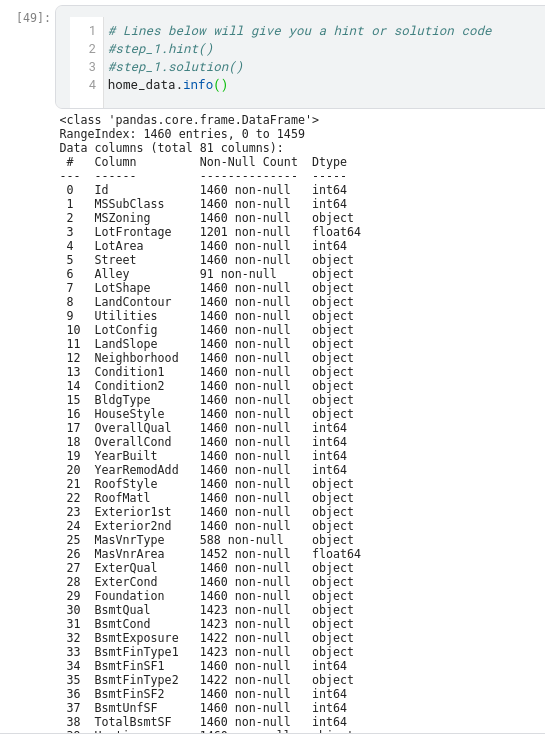
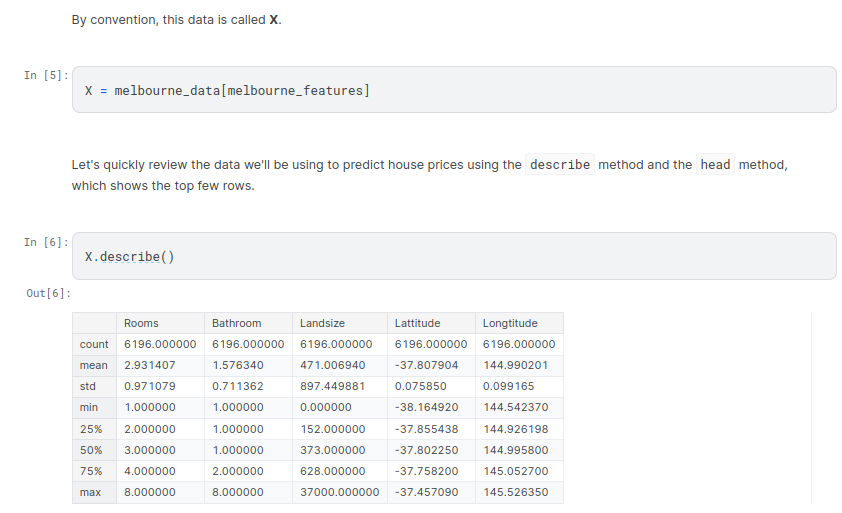
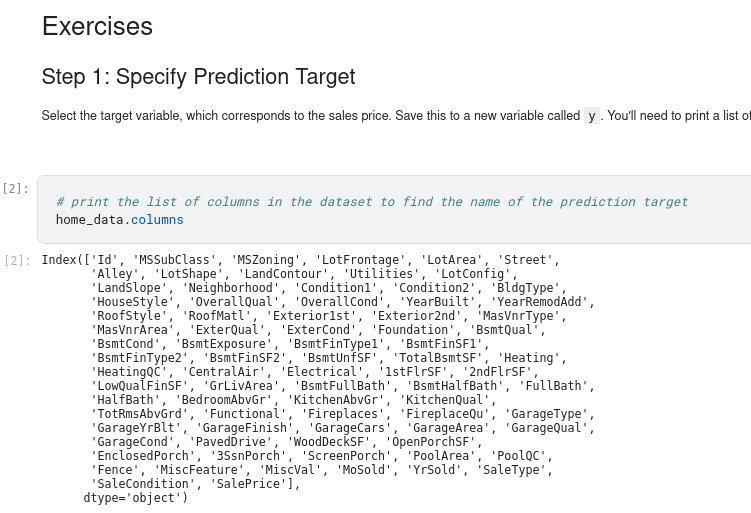
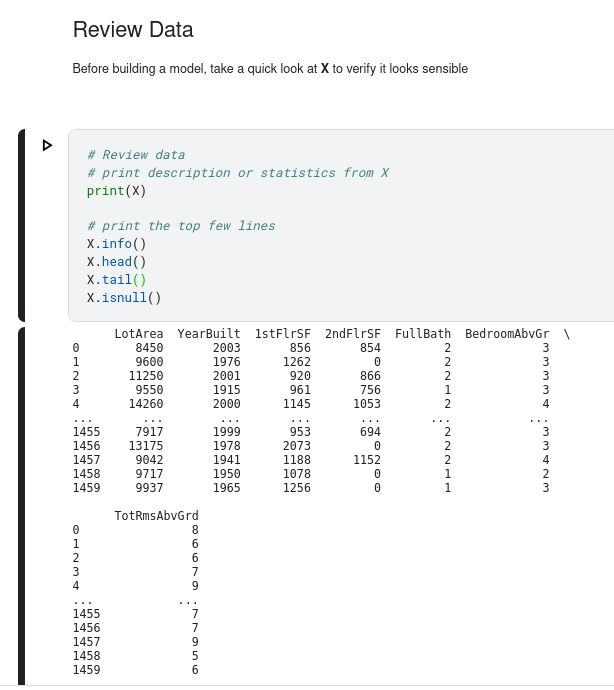
To choose variables/columns, we’ll need to see a list of all columns in the dataset. That is done with the columns property of the DataFrame (the bottom line of code below).
Building Your Model
You will use the scikit-learn library to create your models. When coding, this library is written as sklearn, as you will see in the sample code. Scikit-learn is easily the most popular library for modeling the types of data typically stored in DataFrames.
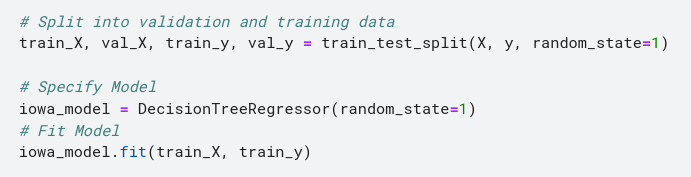
The steps to building and using a model are:
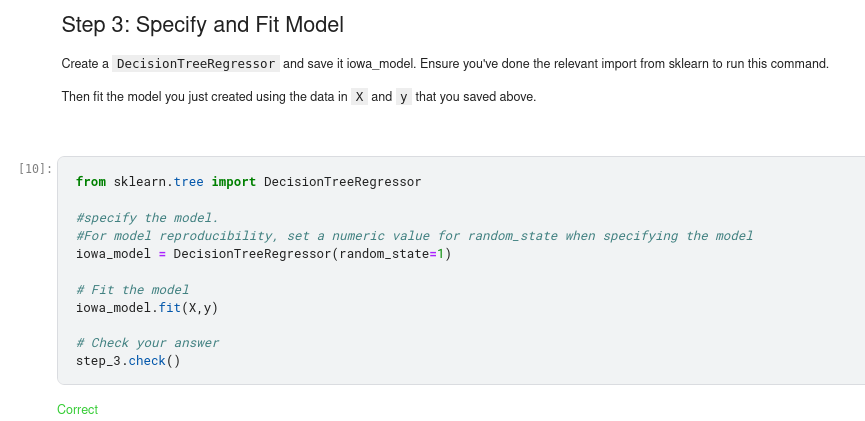
- Define: What type of model will it be? A decision tree? Some other type of model? Some other parameters of the model type are specified too.
- Fit: Capture patterns from provided data. This is the heart of modeling.
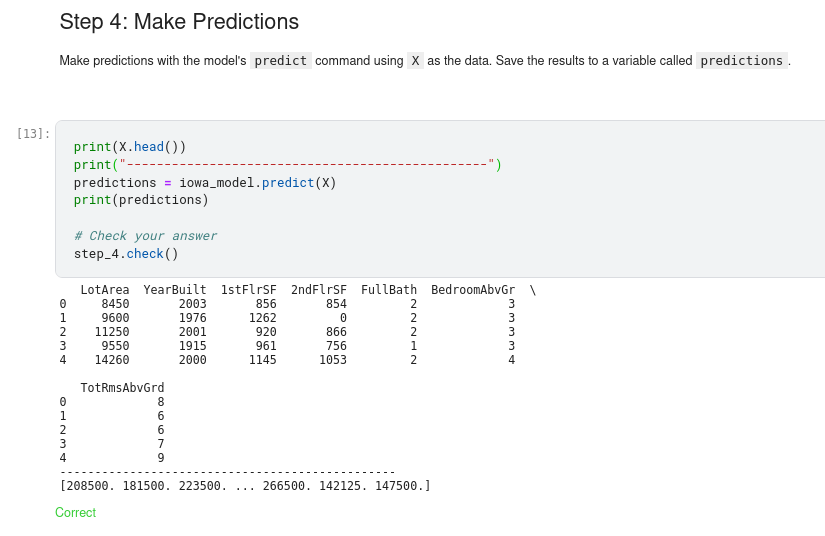
- Predict: Just what it sounds like
- Evaluate: Determine how accurate the model’s predictions are.
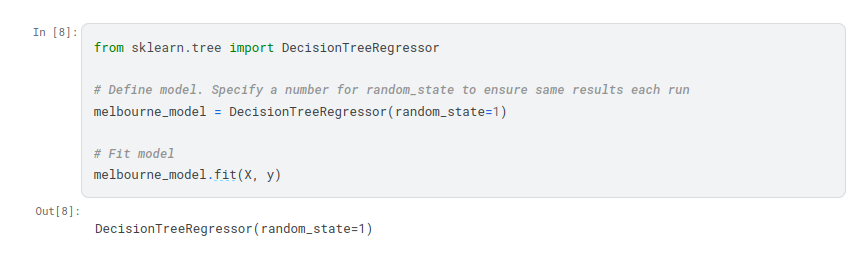
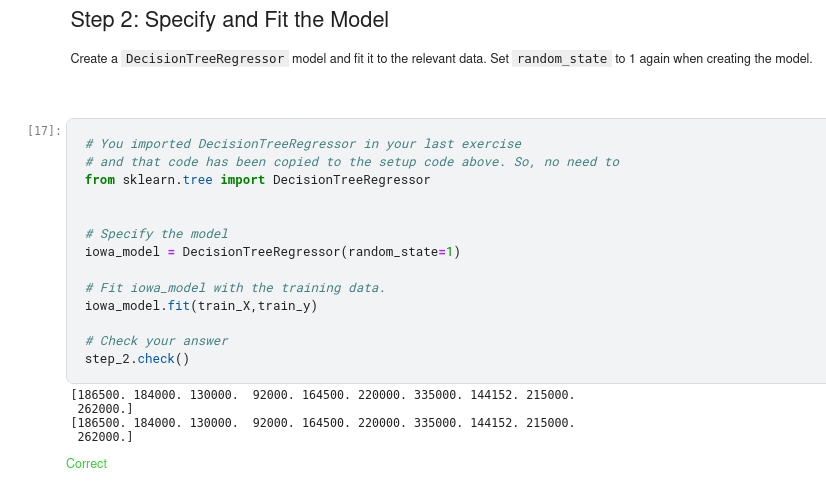
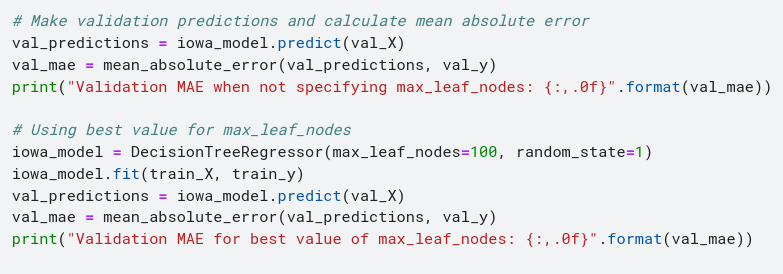
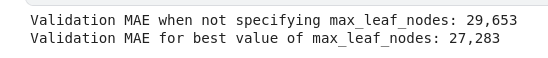
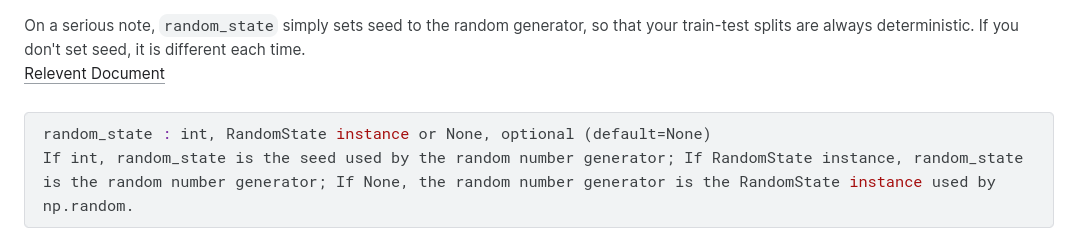
Many machine learning models allow some randomness in model training. Specifying a number for random_state ensures you get the same results in each run. This is considered a good practice. You use any number, and model quality won’t depend meaningfully on exactly what value you choose.
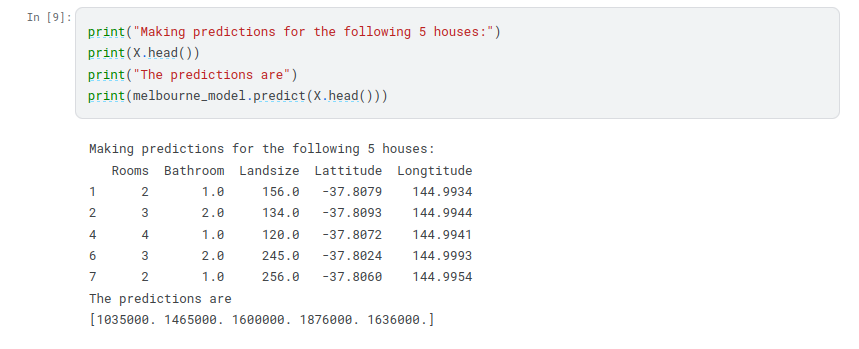
We now have a fitted model that we can use to make predictions.
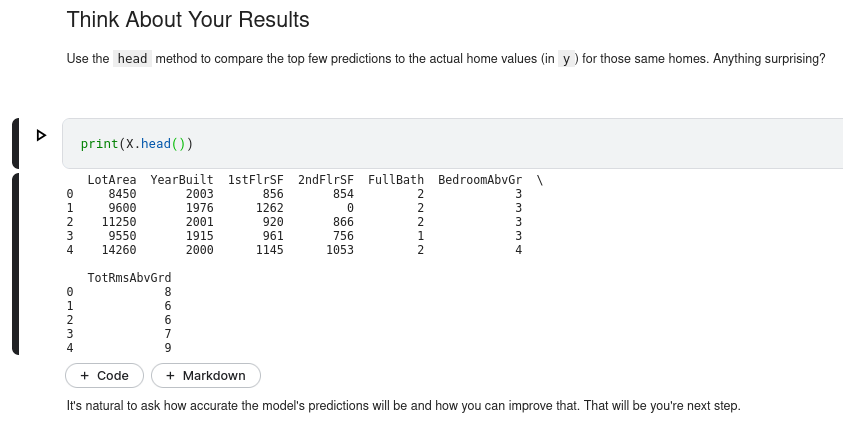
In practice, you’ll want to make predictions for new houses coming on the market rather than the houses we already have prices for. But we’ll make predictions for the first few rows of the training data to see how the predict function works.


Model Validation
You’ve built a model. But how good is it?
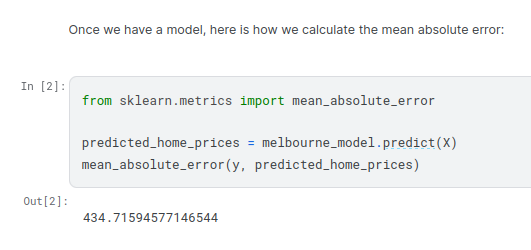
ou’ll want to evaluate almost every model you ever build. In most (though not all) applications, the relevant measure of model quality is predictive accuracy. In other words, will the model’s predictions be close to what actually happens.
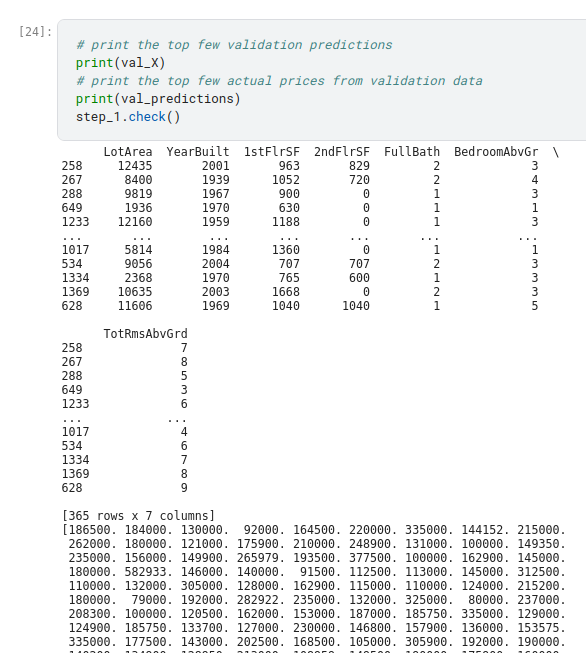
Many people make a huge mistake when measuring predictive accuracy. They make predictions with their training data and compare those predictions to the target values in the training data. You’ll see the problem with this approach and how to solve it in a moment, but let’s think about how we’d do this first.
You’d first need to summarize the model quality into an understandable way. If you compare predicted and actual home values for 10,000 houses, you’ll likely find mix of good and bad predictions. Looking through a list of 10,000 predicted and actual values would be pointless. We need to summarize this into a single metric.
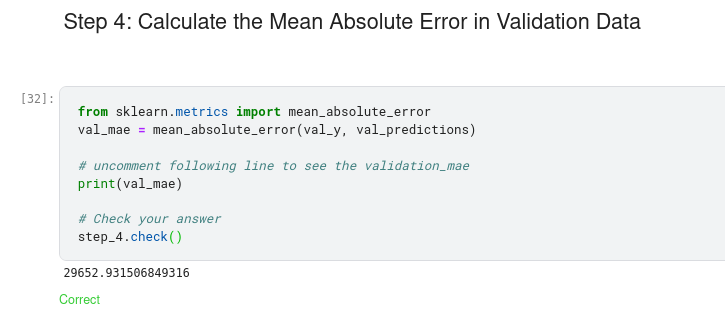
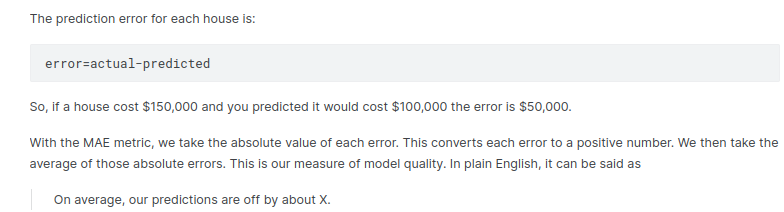
There are many metrics for summarizing model quality, but we’ll start with one called Mean Absolute Error (also called MAE). Let’s break down this metric starting with the last word, error.


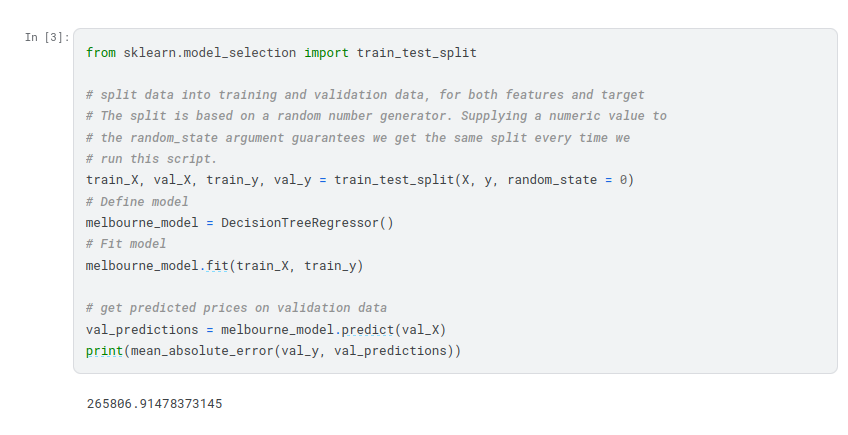
The Problem with « In-Sample » Scores
he measure we just computed can be called an « in-sample » score. We used a single « sample » of houses for both building the model and evaluating it. Here’s why this is bad.
Imagine that, in the large real estate market, door color is unrelated to home price.
However, in the sample of data you used to build the model, all homes with green doors were very expensive. The model’s job is to find patterns that predict home prices, so it will see this pattern, and it will always predict high prices for homes with green doors.
Since this pattern was derived from the training data, the model will appear accurate in the training data.
But if this pattern doesn’t hold when the model sees new data, the model would be very inaccurate when used in practice.
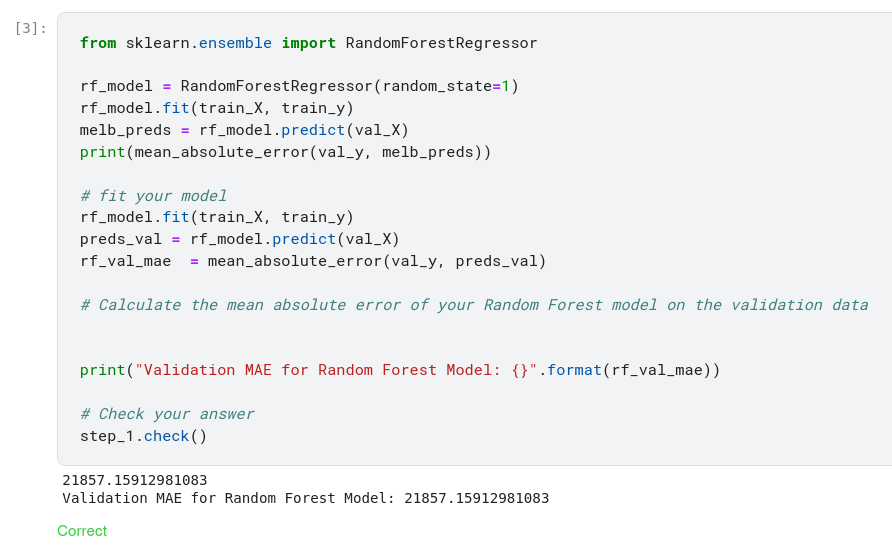
Since models’ practical value come from making predictions on new data, we measure performance on data that wasn’t used to build the model. The most straightforward way to do this is to exclude some data from the model-building process, and then use those to test the model’s accuracy on data it hasn’t seen before. This data is called validation data.

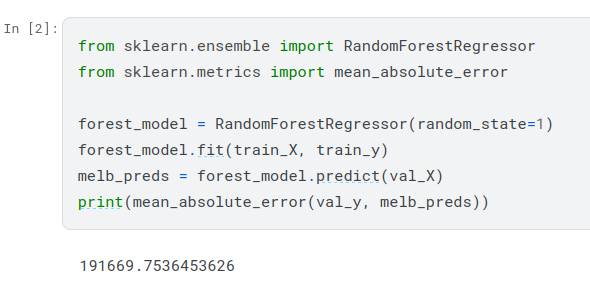
Your mean absolute error for the in-sample data was about 500 dollars. Out-of-sample it is more than 250,000 dollars.
This is the difference between a model that is almost exactly right, and one that is unusable for most practical purposes. As a point of reference, the average home value in the validation data is 1.1 million dollars. So the error in new data is about a quarter of the average home value.